
From EEG to ERP: An automated processing pipeline
Published:
Streamlining data processing, analysis, and visualization for EEG/ERPs with MATLAB and R
Scripts
My lab uses a combined NeuroScan and Brain Vision EEG (electroencephalography) system with 31 active Ag/AgCl electrodes and two bipolar channels.
I developed the processing pipeline presented here for my first experiment on dialectal variation in syntax (attested double modal vs. single modal constructions) in two groups of participants (Unmarked and Southern).
On my Github, you can find the full repositories for the MATLAB scripts and R scripts that are described below.
MATLAB: Data processing
Pre-processing
I adapted a MATLAB script from my former labmate Carla Fernandez to pre-process the EEG data, which includes filtering, re-referencing, epoching, baseline correction, and artefact rejection.
ERPs (event-related potentials)
I wrote this MATLAB script to calculate by-subject (individual) and across-subject (grand) average ERPs for statistical analysis and plotting, respectively.
The script exports the processed data as TXT files for use in R.
R: Statistical analyses and data visualization
(Traditional) ANOVAs
This R script uses the processed data from MATLAB to run a series of within- and between-group ANOVAs, format the results according to APA guidelines, and create data tables that are passed onto the plotting scripts, output to CSV files, and joined with the cleaned behavioral data for correlation analyses.
The ANOVAs were run in two time windows, corresponding to the early anterior negativity (EAN) and P600 components, and in two sets of electrodes: midline (Fz, Cz, Pz) and lateral (LF, RF, LP, RP).
Visualization
Two additional scripts work together to set up plotting parameters and generate butterfly plots.
These scripts pull the significance levels from the analyses in each time window and group and adds them to the ERP plots automatically.
Here is an example of the final plot from my Southern participant group: 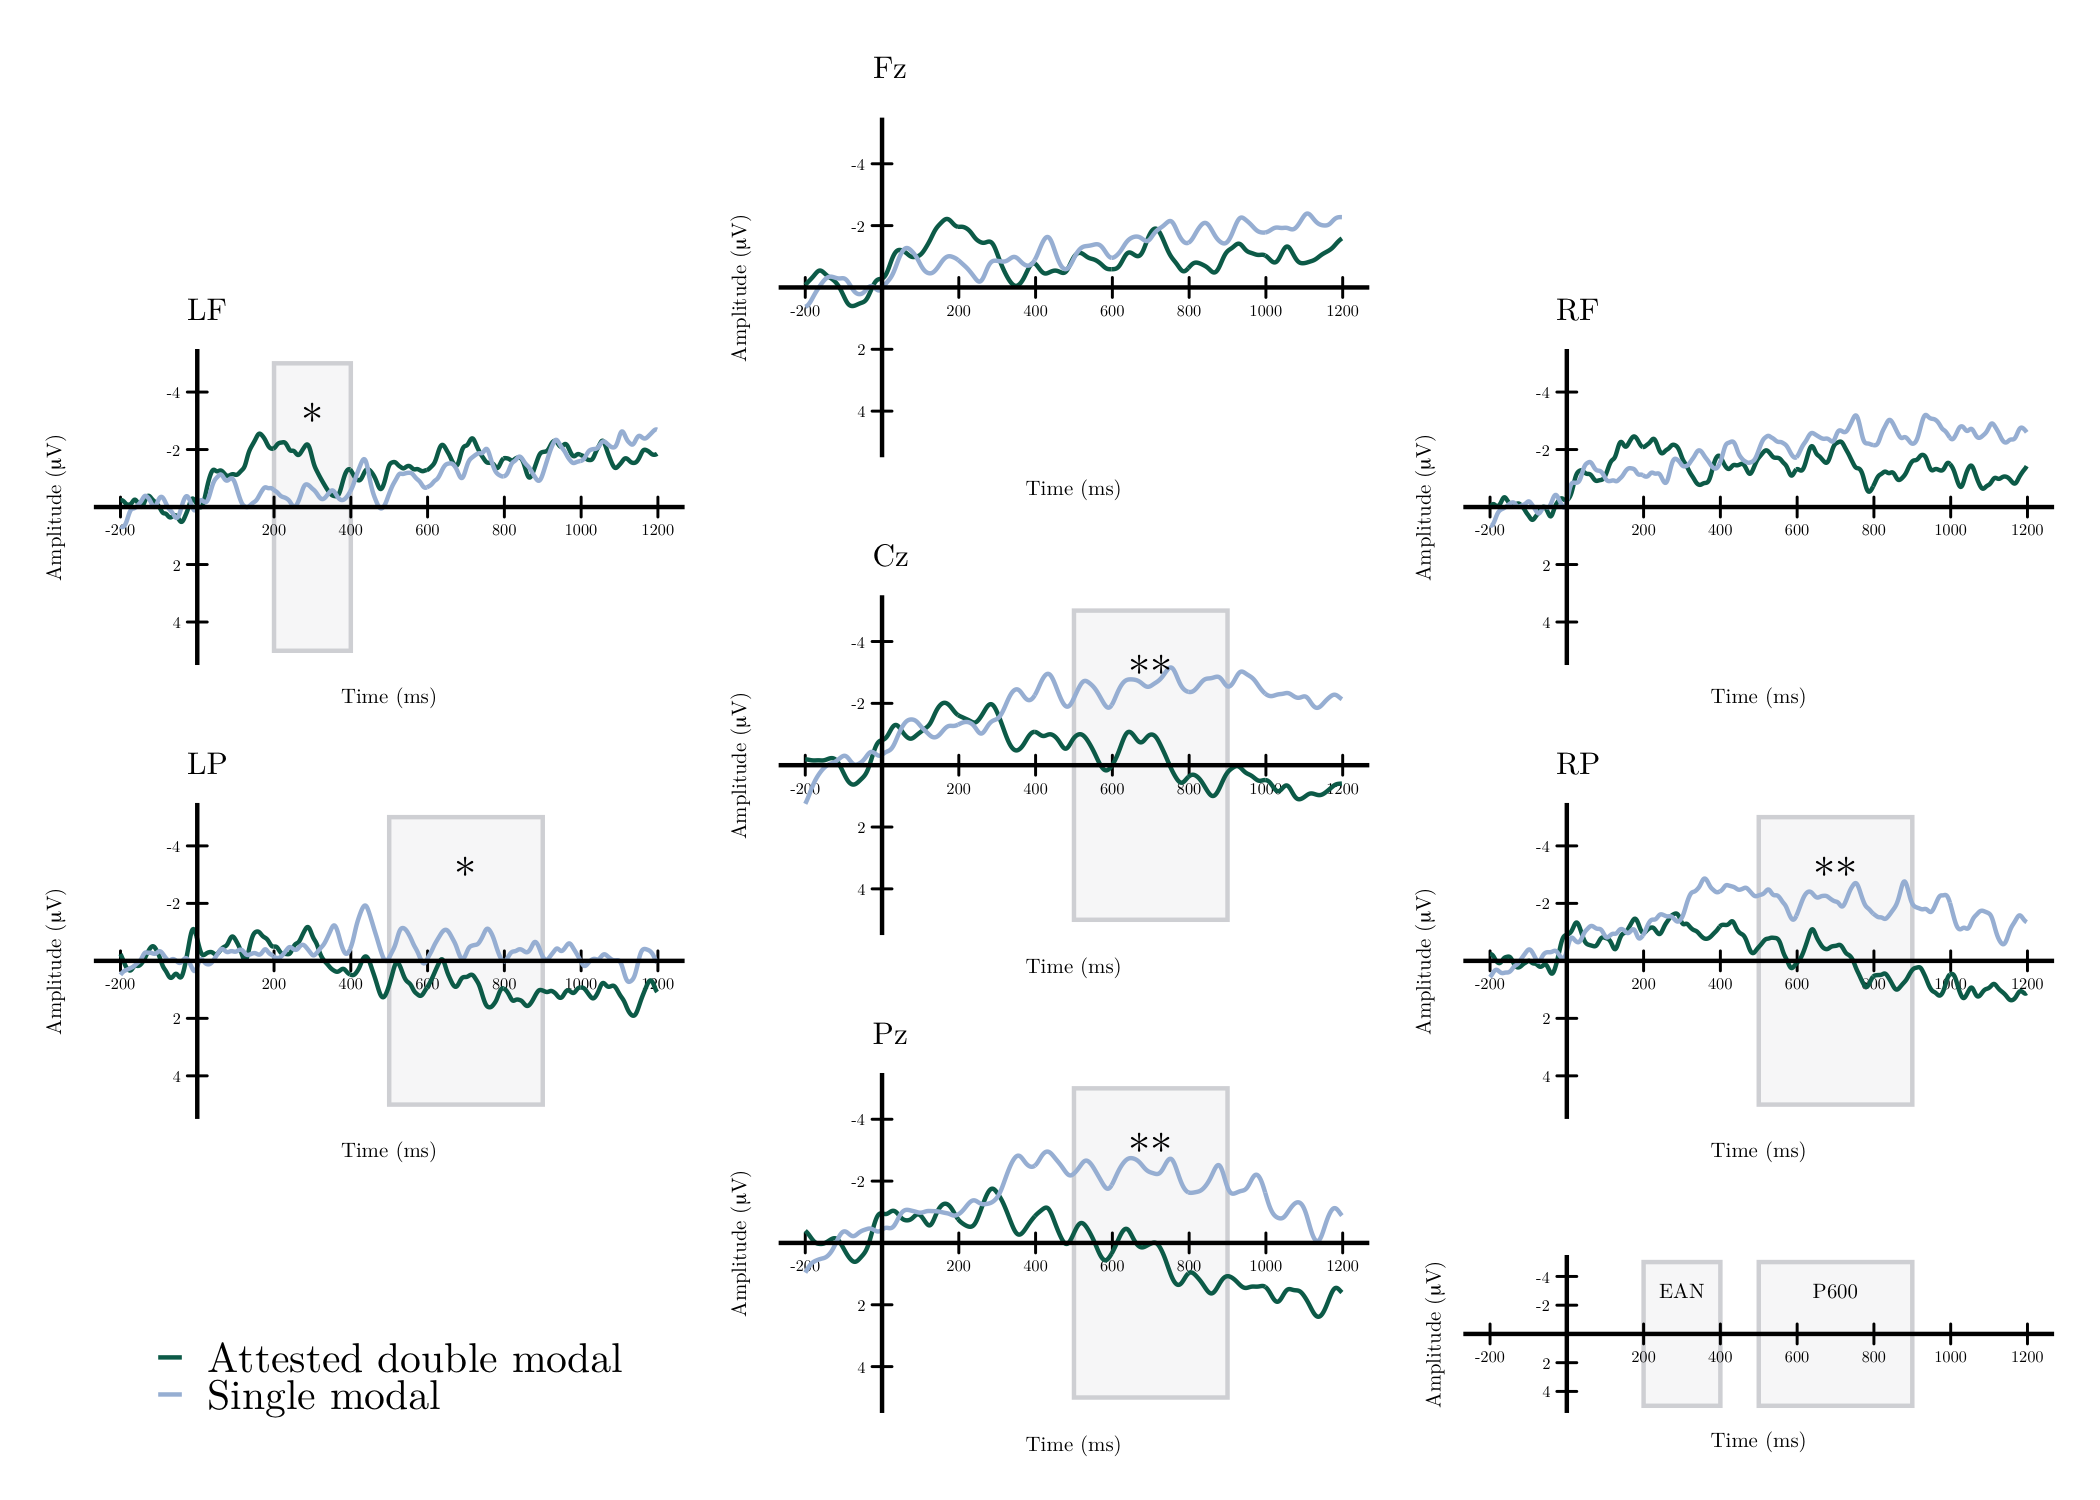
Bayes factors
Contrary to my primary hypothesis, group was not a significant predictor of ERP responses.
In order to provide statistical support for the invariance of group, I learned how to calculate Bayes factors, and thought I would share what I learned.
You can find an example with descriptions here.